

Degree Days
Weather is the biggest factor affecting electric bills. The hotter it is, the more energy it takes to cool a building. Conversely, the colder it is, the more energy it takes to warm the space.
But how do you measure that?
A common question CoServ Customer Care Specialists receive from Members is why their energy usage increased despite their habits staying the same. For example, the thermostat remained at 74 degrees so why did the usage increase this month versus last month?
The difference is the Cooling Degree Days or Heating Degree Days. The hotter or colder it is outside, the harder your HVAC system will work to maintain that temperature. Meaning the Cooling or Heating Degree Days will also be higher for that period.
How would I use that?
Utilities and the government use a metric called Cooling Degree Days (CDD) and Heating Degree Days (HDD) to measure how weather affects electricity usage. This allows an apples-to-apples comparison of one day, week, month or season compared to another.
This same calculation could help CoServ Members and Customers understand why their own usage might be higher for a particular billing period, especially during the hottest summer months or coldest winter months.
Each month, we put together a handy "What to expect" on your next bill that summarizes the previous month's weather stats and degree days so you can better understand the usage behind your bill.
Each month, we put together a handy "What to expect" on your next bill that summarizes the previous month's weather stats and degree days so you can better understand the usage behind your bill.
Each month, we put together a handy "What to expect" on your next bill that summarizes the previous month's weather stats and degree days so you can better understand the usage behind your bill.
Calculating Degree Days
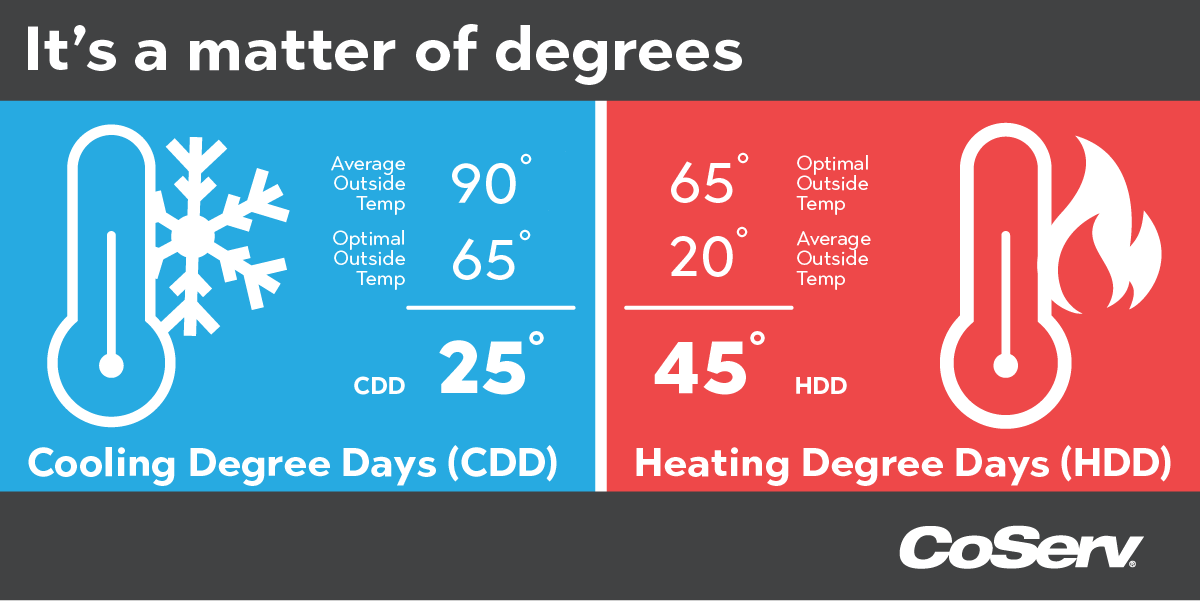
In general, you calculate Cooling Degree Days (CDD) during the summer months and Heating Degree Days (HDD) during the winter months. Begin with a baseline temperature of 65 degrees. At this temperature, it is assumed that homes do not require air conditioning or heating. To calculate CDD, subtract the baseline temperature from the average temperature. For HDD, subtract the average temperature from the baseline temperature. Examples are provided below for better understanding.
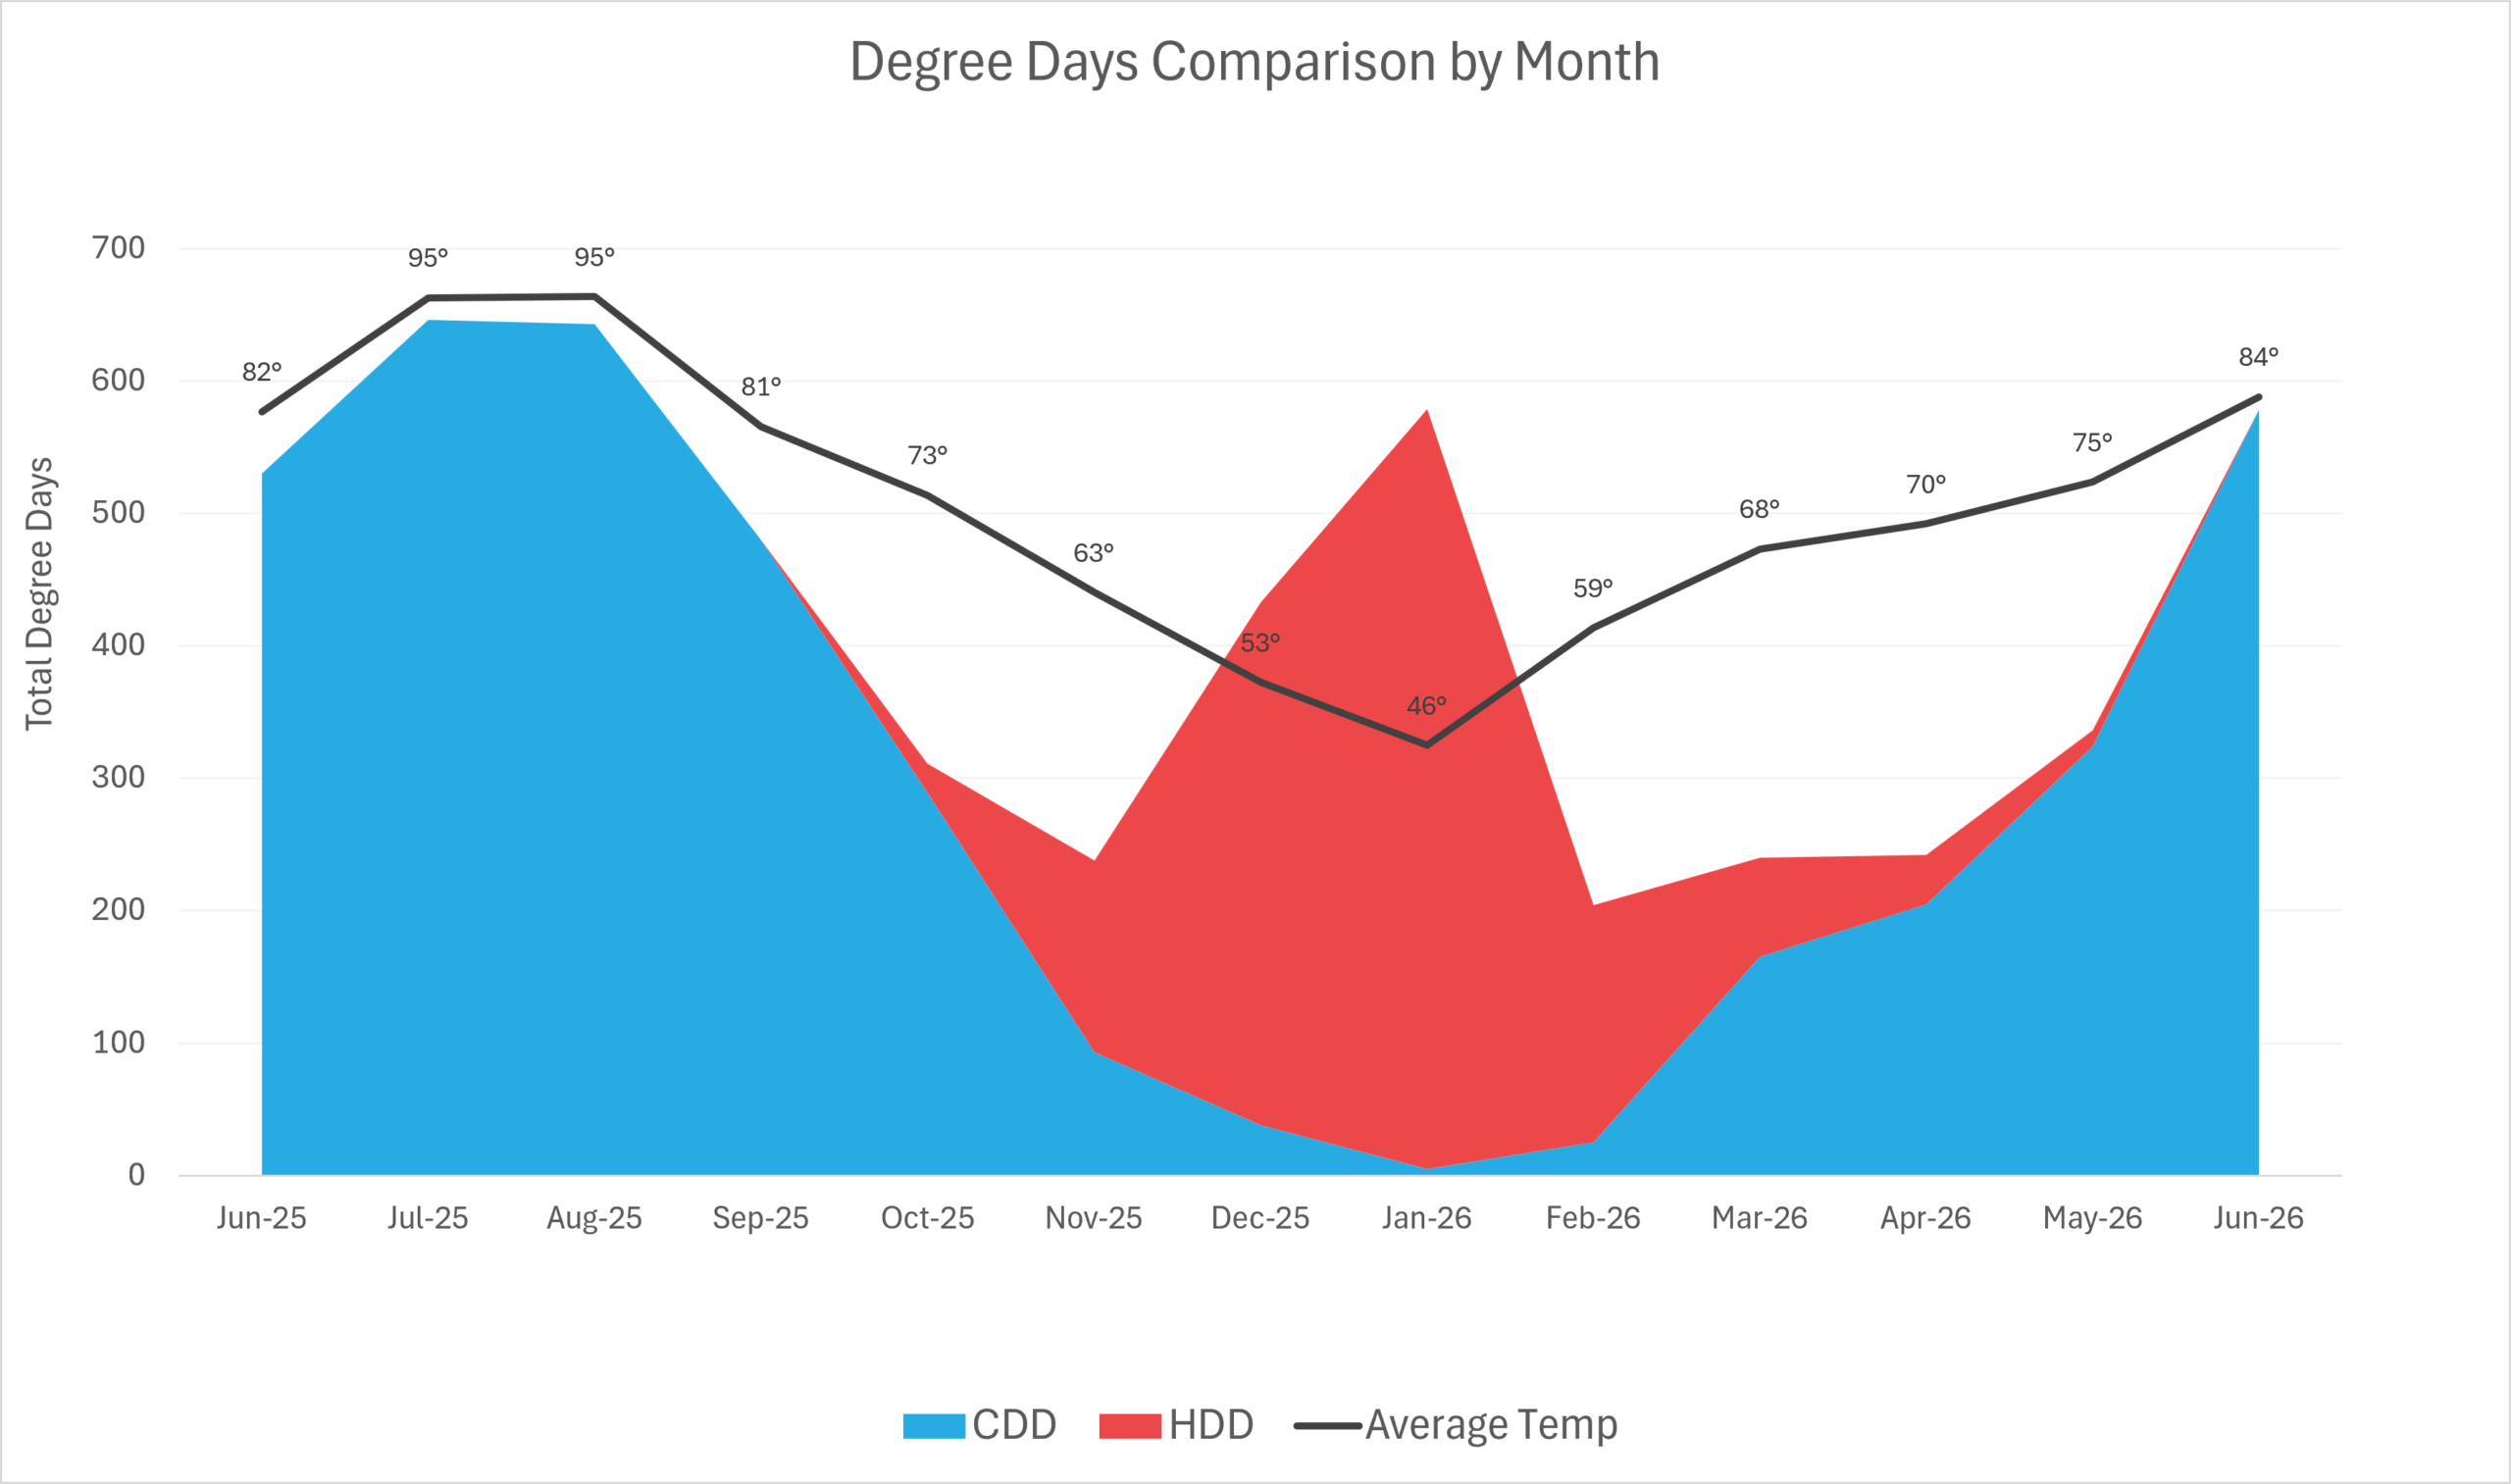
The weather has the most significant impact on your bill. In the graph above, you can see that when temperatures are lower, your heating usage, shown in red, is higher; when temperatures are higher, your cooling usage, shown in blue, also goes up.
IMPORTANT NOTE: Your CoServ billing cycle may not line up with the calendar month, so the impact of the weather on your bill may vary.